Linear Regression
| Topic Review on "Title": |
- Model: an equation used to characterize the relationship between variables and predict future outcomes.
- Models: we can specifically model the relationship of variables with a line and its equation.
- Models use parameters are numbers, or numbers that are derived from the data.
- Recall that the Normal model was specified with mean µ and standard deviation σ.
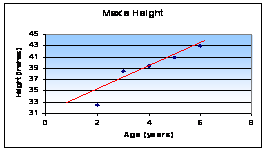
- A linear model is the equation of a straight line through the data.
- Similar to the slope-intercept form of a line, y = mx + b.
- Predicted Value: is the estimate made from a model, known as
 (y-hat). (y-hat).
- Residual: the difference between the observed value and the predicted value of an observation, otherwise known as error.
- Residual =

- Line of Best Fit: The line for which the sum of the squared residuals is minimized, known as the least squares regression line.
- Residual Plot: plots residuals on the vertical axis and the explanatory variable on the horizontal axis.
- Influential Observations: Are those observations that markedly change the position of the regression line.
- R2, coefficient of determination: the proportion of variability of y accounted for by the least squares regression on x.
- Extrapolation: the use of a regression line for prediction outside the domain of values of the explanatory variable we used to obtain the line.
- Least Squares Regression Equation,

- Slope,

- Y-intercept,

- Least Squares Regression Line: Also called the best line of fit.
- This line minimizes residuals between the line and the observed values.
- The y-intercept is the value of y when x = 0
- The slope says that a change of one standard deviation of x corresponds to a change of r standard deviations in y along the regression line
- In other words, the y units per every x unit

|
| Rapid Study Kit for "Title": |
| Flash Movie |
Flash Game |
Flash Card |
| Core Concept Tutorial |
Problem Solving Drill |
Review Cheat Sheet |
 |
 |
 |
|
| "Title" Tutorial Summary : |
This tutorial shows the definitions of linear regression. Basically, a model is an equation used to characterize the relationship between variables and predict future outcomes. A linear model is the equation of a straight line through the data, similar to the slope-intercept form of a line, y = mx + b.
Therefore by completing this tutorial, you will be able to find a linear regression model that best fit the data (minimized the residuals) and thus able to predict future response values or outcomes.
|
| Tutorial Features: |
Specific Tutorial Features:
- Residuals can be used to work out and illustrate the linear regression example problems, step by step.
- Examples showing how to build a model and find the line of fit are provided.
Series Features:
- Concept map showing inter-connections of new concepts in this tutorial and those previously introduced.
- Definition slides introduce terms as they are needed.
- Visual representation of concepts
- Animated examples—worked out step by step
- A concise summary is given at the conclusion of the tutorial.
|
| "Title" Topic List: |
- Model
- Predicted Value
- Residual
- Residual Plot
- Influential Observations
- Verify the fit of a regression line
- Identify, calculate and interpret r2, the coefficient of determination
|
See all 24 lessons in Introductory Statistics, including concept tutorials, problem drills and cheat sheets:
Teach Yourself Introductory Statistics Visually in 24 Hours |


