Home Site Map Contact Us
Rapid Learning Member Login  
Rapid Learning Blog Rapid Learning on Facebook Rapid Learning on Youtube Rapid Learning on Twitter
 How to Learn in 24 Hours?

 Need Help?
M-F: 9am-5pm(PST):
Toll-Free: (877) RAPID-10
or 1-877-727-4310

24/7 Online Technical Support:
The Rapid Support Center
vip@rapidlearningcenter.com

Secure Online Order:
Buy Now


 Got Questions?
Frequently Asked Questions
 Need Proof?
Testimonials by Our Users

Trustlink is a Better Business Bureau Program.
Rapid Learning Center is a fivr-star business.

External TrustLink Reviews


 Member Login:
User ID: 
Password: 
 

 Rapid Learning Courses:

MCAT in 24 Hours (2021-22)

USMLE in 24 Hours (Boards)

Chemistry in 24 Hours

Biology in 24 Hours

Physics in 24 Hours

Mathematics in 24 Hours

Psychology in 24 Hours

SAT in 24 Hours

ACT in 24 Hours

AP in 24 Hours

CLEP in 24 Hours

DAT in 24 Hours (Dental)

OAT in 24 Hours (Optometry)

PCAT in 24 Hours (Pharmacy)

Nursing Entrance Exams

Certification in 24 Hours

eBook - Survival Kits

Audiobooks (MP3)


 Tell-A-Friend:
Have friends taking science and math courses too? Tell them about our rapid learning system.


Sampling Distributions

Topic Review on "Title":
  • Parameter: a number describing the population
  • Statistics: a number describing the sample
  • Random Sample: every unit in the population has equal probability of being sampled
  • Sampling distribution: the probability distribution of a statistic is called its sampling distribution
  • Sample vs. population: Population is unknown, so we study the sample in order to draw conclusions about based on the sample.
    • A random sample should be representative of the population
    • The statistics of random sample should be good and reasonable estimates of the parameters of the population
    • So sampling distribution is important because they are the basis for making statistical inferences about a population from a sample.
    • Sample statistics are subject to error in the estimation of population parameters.
    • Sample statistics will have a distribution when we take repeated samples and calculating their statistics (eg. Mean)
    • The mean of the sampling distribution of the mean is about the same as the mean of the original population of individuals. 
    • In any one sample, the extremes tend to be balanced out by a middle score or by an extreme in the opposite direction.
    • This makes each sample mean tend toward the middle and away from extreme values.
    • Therefore we have fewer extreme means and thus the variance of the means is smaller.                          


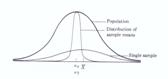
    Normal Population (Data): If data are normally distributed with mean m and standard deviation s, and random samples of size n are taken,

    Then the sampling distribution of the sample means is also normally distributed.

    The mean of all of the sample means is m.

    The standard deviation of the sample means is s/√n

    Non-Normal Population (Data): Even if data are not normally distributed, as long as you take “large enough” samples, the sample averages will at least be approximately normally distributed.

    Mean of sample averages is still m

    Standard error of sample averages is still s/√n

    In general, “large enough” means more than 30 measurements.      

    Central Limit Theorem: even if data are not normally distributed, as long as you take “large enough” samples, the sample averages will at least be approximately normally distributed.

    Mean of sample averages is still m

    Standard error of sample averages is still s/√n

    In general, “large enough” means more than 30 measurements.


Rapid Study Kit for "Title":
Flash Movie Flash Game Flash Card
Core Concept Tutorial Problem Solving Drill Review Cheat Sheet

"Title" Tutorial Summary :

This tutorial introduces the sampling distribution their properties. Sampling distribution is important because they are the basis for making statistical inferences about a population from a sample. For instance, the mean of the sampling distribution of the mean is about the same as the mean of the original population of individuals and therefore we can use it to make inference about the population.

Numerous examples are provide to explain how to apply sampling distribution in different population distribution (normal and non-normal population data). Therefore after completing the tutorial, you will be able to apply the knowledge of smapling distribution to make inference about the population.


Tutorial Features:

Specific Tutorial Features:

  • Step by step examples of the different aspects of the sampling distribution.
  • Examples are also given to illustrate how to apply the sampling distribution in different population size or distribution scenario.

Series Features:

  • Concept map showing inter-connections of new concepts in this tutorial and those previously introduced.
  • Definition slides introduce terms as they are needed.
  • Visual representation of concepts
  • Animated examples—worked out step by step
  • A concise summary is given at the conclusion of the tutorial.

"Title" Topic List:
  • Sampling and sampling distribution
  • Relationship between sample and population
  • Sampling distribution of the mean
  • Sampling distribution for normal distribution
  • Sampling distribution for non-normal population
  • Central Limit Theorem.


See all 24 lessons in Introductory Statistics, including concept tutorials, problem drills and cheat sheets:
Teach Yourself Introductory Statistics Visually in 24 Hours

© 2021 Rapid Learning Inc. All rights reserved         Disclaimer | Privacy Policy