Variability
| Topic Review on "Title": |
Key Formulas
- IQR = Q3 – Q1
 s2 = (1 / (n-1)) ∑(xi– x)2 s2 = (1 / (n-1)) ∑(xi– x)2 s = √s2 s = √s2
Variables Used
- Q1= 1st quartile
- Q3 = 3rd quartile
- M = Median
- s2 = variance
- s = standard deviation
Q1 and Q3
- To find 1st and 3rd quartiles:
- Order the data, find n and median.
- Divide the data in half.
- Find the position of the middle value of each half.
- Determine the value represented by each middle position.
Five Number Summary
- To find the five number summary:
- Order the data, find n and median.
- Find the 1st and 3rd quartiles.
- Order the five number summary according the symbols: Minimum Q1 M Q3 Maximum
Standard Deviation
- When calculating the standard deviation, use a table to keep data separated and ordered.
- First, find the mean of the data set.
- Second, find the deviation from the mean of each observation.
- Third, square the deviations.
- Fourth, take the sum of the deviation squares.
- Fifth, find the variance.
- Sixth, take square root of variance to get standard deviation.
|
| Rapid Study Kit for "Title": |
| Flash Movie |
Flash Game |
Flash Card |
| Core Concept Tutorial |
Problem Solving Drill |
Review Cheat Sheet |
 |
 |
 |
|
| "Title" Tutorial Summary : |
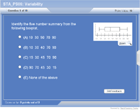
This tutorial describes what variability is and its properties. We will show you how to use specific measures of spread to interpret distributions, calculate and interpret quartiles, make a five number summary of data, construct a box plot of five number summary and calculate the standard deviation of a distribution.
After we use the five number summary to make a box plot we will then know how to identify outliers that will greatly affect the variability of the distribution.
|
| Tutorial Features: |
Specific Tutorial Features:
- Step by step examples are shown to introduce variability. Examples as to how to interpret distributions, calculate and interpret quartiles are detailed in the tutorial.
- Details as to how to make a five number summary of data, construct a box plot of five number summary and calculate the standard deviation of a distribution are also presented with proper example in this tutorial.
Series Features:
- Concept map showing inter-connections of new concepts in this tutorial and those previously introduced.
- Definition slides introduce terms as they are needed.
- Visual representation of concepts
- Animated examples—worked out step by step
- A concise summary is given at the conclusion of the tutorial.
|
| "Title" Topic List: |
- Variability
- Quartiles
- Q1
- Q3
- Five number summary
- Boxplot
- Interquartile range
- Variance
- Standard deviation
|
See all 24 lessons in Introductory Statistics, including concept tutorials, problem drills and cheat sheets:
Teach Yourself Introductory Statistics Visually in 24 Hours |


